
The Great Philadelphia Rent-To-Value Divide
If you’ve been tracking Philadelphia’s rental market lately, you may have noticed something striking: rent-to-value (RTV) ratios are splitting across a clear divide.
Using FishFyndr’s data and Market Trends, we can see a bifurcation line stretching roughly between Bensalem, Cheltenham, and Marple. Southeast of that line, properties almost universally offer better rent-to-value ratios, while northwest areas lag behind.
For investors, this divide is more than just a map curiosity — it’s a potential roadmap for where your money could work harder.
Philadelphia’s Rental Market Snapshot
According to recent reports, Philadelphia’s average rent is about $1,443, up 1.1% in the past month and 0.6% over the past year. That’s faster growth than the national average, which actually dropped by -0.7%. Even so, Philadelphia remains about 7.7% cheaper than the broader metro area, making it an attractive city for renters and investors alike.
This balance of affordability and growth helps explain why RTV ratios are shifting so clearly across neighborhoods — and why southeastern zip codes are leading the way.
The Rent-To-Value Divide: Southeast vs. Northwest
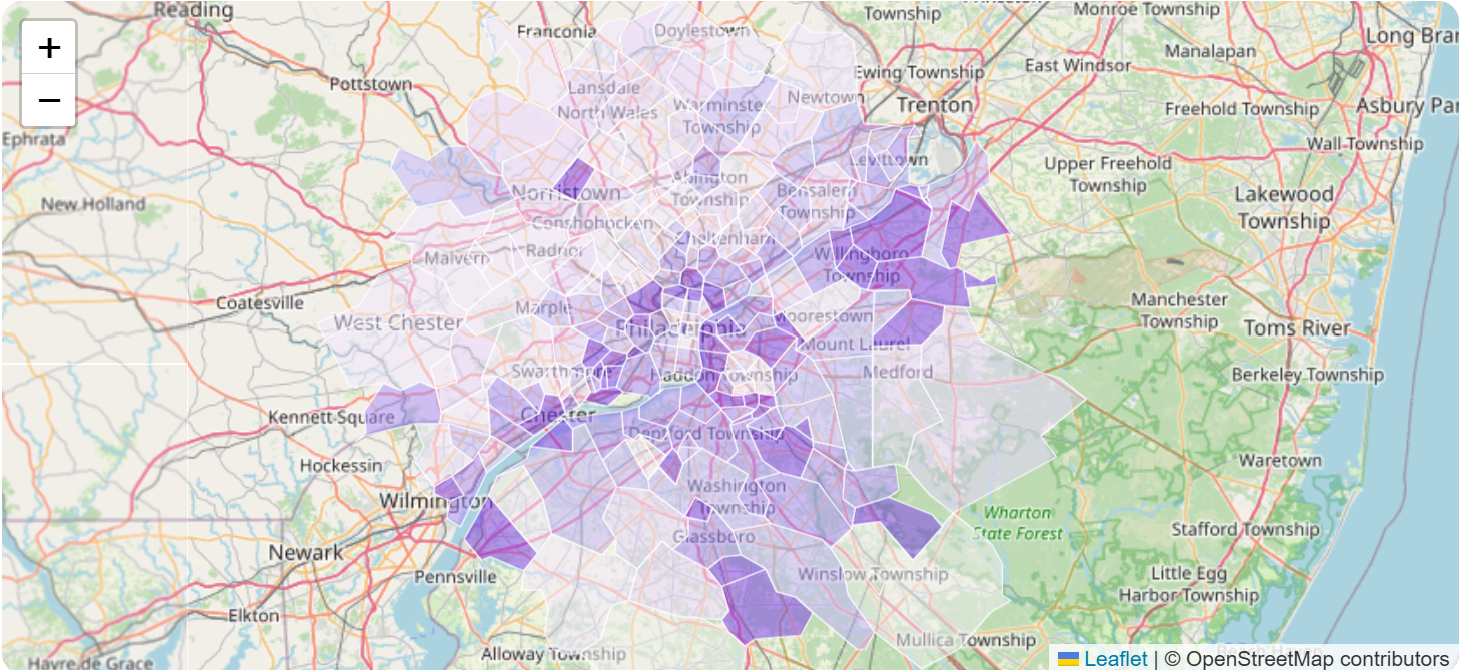
Data shows a consistent pattern southeast of the line from Bensalem through Cheltenham to Marple:
- Higher RTV ratios → Rent relative to property values is stronger, boosting cash flow potential.
- Denser rental demand → Driven by proximity to Center City, universities, and job hubs.
- Diverse stock → Smaller multifamily properties and rowhomes that command competitive rents.
In contrast, northwest neighborhoods and suburbs often have higher property values without the same rent upside, pushing RTV ratios down.
Why This Matters for Investors
For real estate investors, chasing appreciation is one strategy. But if you’re focused on cash flow and predictable returns, rent-to-value ratios are one of the most important signals.
Here’s why focusing southeast of the divide could pay off:
- Better ROI potential → Higher RTV means stronger monthly income relative to purchase price.
- Lower entry costs → Many of these neighborhoods are still more affordable than suburban counterparts.
- Resilient demand → Renters continue to favor access to jobs, transit, and urban amenities.
By contrast, the northwest may still offer long-term appreciation — but for income-focused investors, the southeast side of the city is looking more promising.
Using FishFyndr to Track Philadelphia’s Market
At FishFyndr.com, you can explore:
- Market Trends: Track rental price shifts by zip code, and see how RTV is changing across the region.
- RTV Analytics: Quickly identify high-RTV properties and compare predicted vs. actual listing prices to spot undervalued opportunities.
With the divide so clear in the data, these tools help you zero in on properties that line up with your investment goals.
Key Takeaways
- Philadelphia’s average rent is $1,443, up slightly despite national declines.
- A rent-to-value divide runs from Bensalem–Cheltenham–Marple, with stronger RTV ratios southeast of that line.
- Investors looking for cash flow should pay close attention to southeastern Philadelphia zip codes.
- FishFyndr tools make it easy to explore RTV by neighborhood and find high-potential opportunities.
FAQs About Philadelphia Rental Market Analysis
What is the average rent in Philadelphia right now?
As of the latest reports, the average rent is $1,443, up 1.1% in the past month and 0.6% over the past year.
What does rent-to-value mean for investors?
Rent-to-value (RTV) measures monthly rent compared to property value. Higher RTV = stronger cash flow relative to your investment.
Which Philadelphia neighborhoods have the best RTV ratios?
Currently, neighborhoods southeast of Bensalem–Cheltenham–Marple show the strongest RTV ratios, making them more attractive for investors seeking income properties.
Why is there a divide in RTV ratios across Philadelphia?
It’s partly geography and partly economics — southeastern neighborhoods benefit from denser demand, better transit access, and more affordable housing stock, driving up RTV.
FAQs About FishFyndr.com
What is FishFyndr.com?
FishFyndr.com is a real estate analytics platform designed to help investors find profitable rental properties.
What data does FishFyndr provide?
- Rent-to-value ratios
- Predicted vs. actual property prices
- Rental trends by zip code
Does FishFyndr cover Philadelphia?
Yes — in addition to Atlanta, we’re now expanding to cover Philadelphia’s rental market.
Can FishFyndr help me find high-RTV properties?
Yes — our RTV Analytics tool is built to help you quickly find and filter properties with strong RTV ratios.
Final Thoughts
The Philadelphia rent-to-value divide is real — and for investors focused on steady returns, it’s an opportunity hiding in plain sight.
By focusing on southeastern neighborhoods and using data from FishFyndr’s Market Trends and RTV Analytics, you can position yourself ahead of the curve.
Start exploring Philadelphia’s best high-RTV opportunities today at FishFyndr.com